Land Use Maps

1954
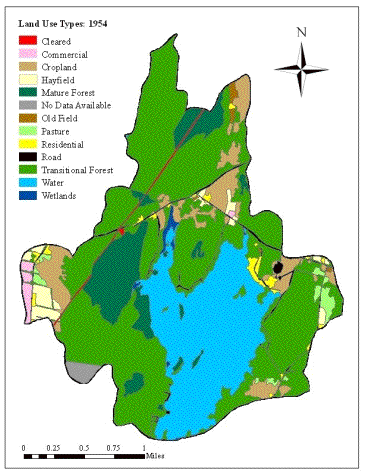
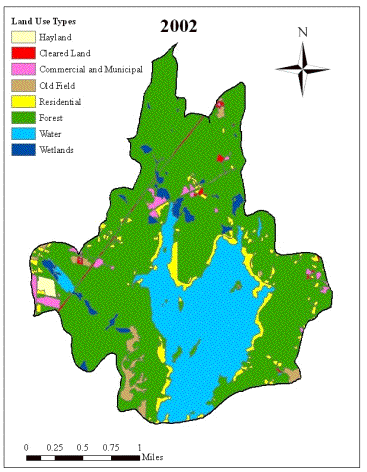
| These are the final land use
maps for the watershed in 1954 (on the left) and 2002 (on the right). From these maps, we were able to
calculate the area of the watershed comprised by each land use type. |
|
| This data was used
specifically in the calculation of the P budget, which will be discussed in
the second half of the presentation.
The maps were also used to make general inferences about the impact of
each land use type of the water quality of the lake. |
|
| Let�s look at a few quick
things with these land use maps, and I will develop some of these further a
little later. |
|
| First of all, notice the
gray area in the southwest of the 1954 land use map. This is a small area of the watershed
which we did not have an aerial photo, so there is no land use data available
for this area. |
|
| It�s fairly obvious to see
that the majority of the watershed is forest in both years. But also notice the difference I
mentioned before between the mature and transitional forest classifications
in the 1954 map (shown by the dark and light green colors), and the single
forest classification for 2002 (shown by the single green shade). This again was because the 2002
photos were taken in April. |
|
| The yellow areas in the maps
represent residential land, which, as you can see, is much more prevalent in
the 2002 map, and is concentrated around the lake shore. |
|
| There are significantly more
agricultural areas in the 1954 map, as you can see here on the western edge,
here to the north of the lake, and here on the eastern edge of the
watershed. In contrast, notice
the very small amount of agriculture in 2002, just here on the western edge. |
|
| Also, the roads of the
watershed were digitized for the 1954 map in order to approximate the area
under this land use type (the roads are shown by the black lines, mostly to
the north of the lake). For the
current roads of the watershed, however, we conducted a field survey to more
accurately measure the road area.
Thus, the roads are not digitized in the 2002 map. |