|
|
|
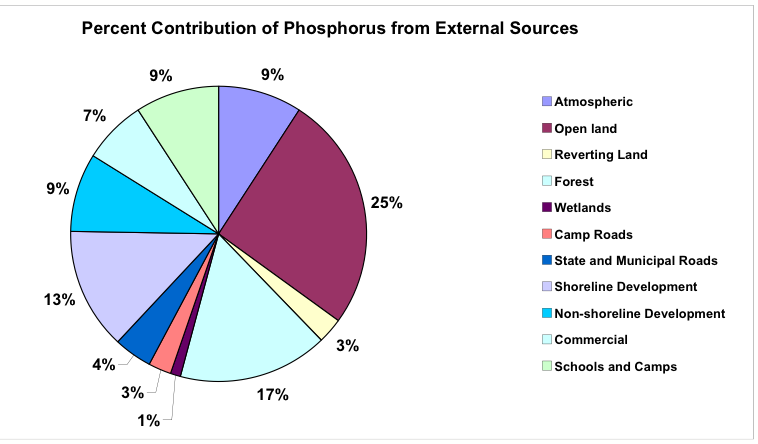
As I mentioned earlier, the
phosphorus model also estimates the amount of phosphorus released by specific
land use types and other sources of phosphorus.
|
|
This chart shows the percent
contribution of phosphorus from specific external sources.
|
|
Of all external sources,
agricultural uses, forest, and shoreline development and septic systems
contributed the greatest amounts of phosphorus.
|
|
According to our best
estimate, agricultural land accounted for 23% of the total phosphorus from
external sources (point out maroon). This is comprised of both cropland and pasture. Although cropland represents only
0.02% of the watershed, relatively high amounts of phosphorus can flow into
the lake from fertilizers applied to the land. Pasture, on the other hand, exports much less phosphorus
per area, but represents a much larger area within the watershed. These characteristics cause
agricultural land to contribute relatively high amounts of phosphorus to the
lake.
|
|
Forest also contributed a
large amount of phosphorus to the lake (purple), however, this does not mean
that mature forest is bad! In
fact, forested land contributes very little phosphorus per area, because the full
canopy helps to reduce the velocity of rain, and the roots help to hold soil
in place and absorb nutrients.
Forested land contributes so much phosphorus because it accounts for
62% of the total watershed area.
Remember that the total amount of phosphorus contributed by a
particular land type is equal to the export coefficient multiplied by the
area, so even with a very low export coefficient, a large area will cause the
total amount of phosphorus contributed to be large.
|
|
Together, shoreline
development and shoreline septic systems contributed 13% of total phosphorus
from external sources. Although
shoreline lots account for a small proportion of the total area of the
watershed, this small amount of land can have a large impact on water quality. Water running off lawns, roofs, and
other surfaces can carry phosphorus directly into the lake if buffer strips
are not adequate, and septic systems built too close to the shore or in
unsuitable soil types can lead to the movement of nutrients from the system
into the lake.
|
|
So far, I�ve talked about
three different slices of the pie chart that represent relatively large
contributors of phosphorus to the lake, but if you around the chart at all of
the percentages listed, you�ll
see that there are many other sources that contribute similar amounts (For
example, 9% atmospheric (periwinkle), 7% commercial development (lt. green),
7% from roads(pink and blue)).
With the exception of atmospheric deposition, which is phosphorus that
enters the lake directly through rainfall, the amount of phosphorus from the
majority of these sources could be reduced by improving buffer strips,
maintaining septic systems, and
maintaining roads.
|
|
Remember, these are only
external sources of phosphorus�
|