

Dissolved
Oxygen (DO)
Dissolved oxygen (ppm) profile in 2006 for Long Pond North at
site 1.
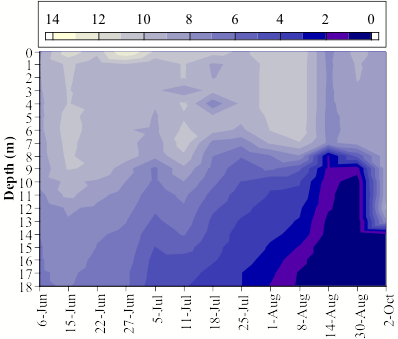
| We found that at site 1, the
deepest site, bottom water became anoxic towards the end of the summer, with
concentrations of less than 1 ppm. This graph has time along the x-axis and
depth along the y-axis, with shallower depths at the top. The coloration
depicts dissolved oxygen concentration in ppm, with darker blue representing
lower DO concentrations. This figure shows that bottom water became anoxic
around the 7th of August. It is important to note that by the 14th of August,
all water below 10m was anoxic, which means there was about 8 meters of
anoxic water at the bottom of the lake, which is a lot. The anoxia decreased
by the beginning of october because of the beginning of turnover and fall
mixing, which I will explain with the temperature data. This anoxia is one of
the reasons why DEP recently listed Long Pond as impaired. This is a problem
because when bottom waters become anoxic, phosphorus levels are affected. |