|
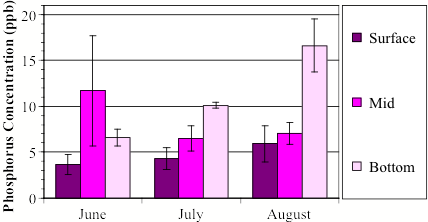
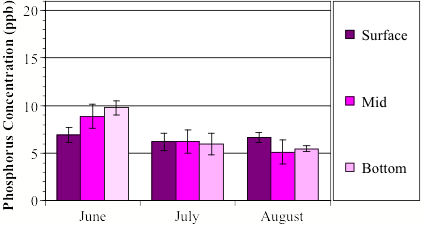
These two figures have
phosphorus concentration in ppb on the y-axis and month on the x-axis. They
depict surface, mid, and bottom total phosphorus means for sites 1 and 3
respectively. If we focus for now on the site 1 graph, the top graph, we see
a large increase in bottom total P concentrations from June to August,
confirming that the decreasing bottom DO concentrations that we saw earlier
are leading to increased P release from sediments.
|