|
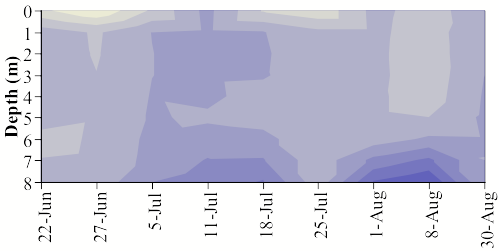
So, going back to the
dissolved oxygen data, here we have another dissolved oxygen graph, similar
to the earlier one I showed you, except this is for site 3. Again, the blue
coloration represents dissolved oxygen concentration in ppm. From this graph,
we can tell that at site 3, a shallow sites, waters did not become anoxic
over the course of the summer.
|