|
So to explain this
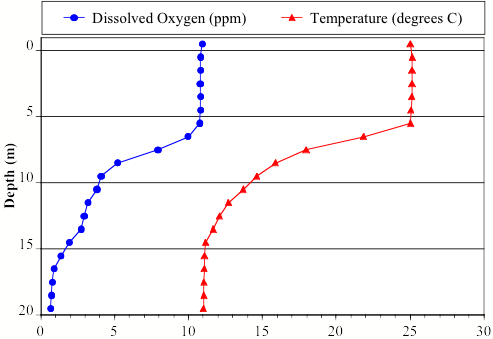
observation, we can look at our temperature data. Here, temperature is in
˚C along the x-axis, and for now, you can ignore the blue line and focus
on the red line. The temperature shows a distinct thermocline, where there is
a period of rapid temperature decline. On this graph, this occurs bewteen 5
and 10 meters. This stratification of the water column by temperature only
occurred at the deeper site 1 and was not observed for the shallower sites.
|