

pH
2006 pH profiles
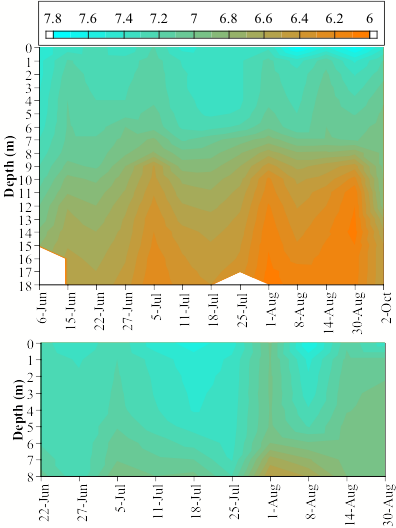
SITE 1
SITE 3
| Bottom sediment retention of
phosphorus is maximized at pH of 5-7. This figure has depth along the y-axis
with shallower depths at the top, and time along the x-axis. Orange color
represents lower, more acidic pH. Both site 1 and site 3 fell within this
maximum retention range over the majority of depths, which is an indicator of
good overall lake health. |
|