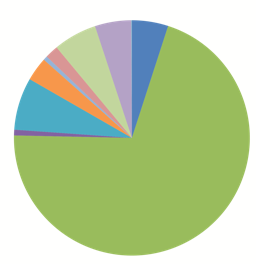
Land Use vs. Phosphorus
% Land Use
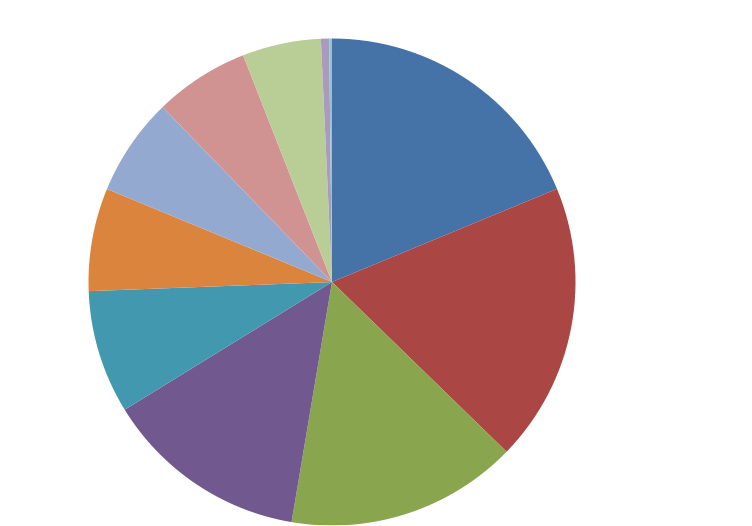
% Phosphorus


| These two pie charts show
the percentage of Phosphorus contributed by each source and the percent of
the watershed covered by each land use. The 11 land uses categories shown
here are groupings of 21 different phosphorus sources indentified. |
|
| Development contributed
the highest amount of phosphorus to the lake despite its small land cover.
Septic systems contributed the second highest amount of Phosphorus. Both
non-shoreline residential areas and septic systems contributed more
phosphorus that shoreline residences. However, remember there are three times
as many non-shoreline residences
as shoreline ones. |
|
| The third highest
contributor of Phosphorus is forests. Although forests contribute a very
small amount of phosphorus per acre, they make up over two thirds of the
watershed area. |
|
| Roads are the fourth
largest source of phosphorus. They are a very problematic source of
phosphorus considering their small area. While they are make up less that 1%
of the watershed area, they contribute over 13% of the phosphorus. |
|
| The remaining 7 soucres
contribute just a third of the phosphorus. Two that are worth mentioning are
recreational areas (which include commercial camps and campgrounds) and
logged and cleared land. Recreational areas can have an adverse impact
because they tend to concentrate larger numbers of people along the shoreline
for extended periods of time. Logged and cleared land can potentially add
large amounts of phosphorus by promoting erosion. |